See the market you are job hunting in

Where the roles are, which companies are hiring, and how that has moved. Built from the postings we collect, not from a survey.

Most hiring commentary is vibes. We happen to be sitting on a continuously refreshed index of open roles pulled from employer systems, so we can answer some of these questions directly instead of guessing.

The stats pages show the shape of what we have collected: distribution by location, by company, by role type, and how that has changed. It is a view of our index, which is a large sample rather than the whole market, and the pages say so.

It is worth ten minutes before you decide which titles to target or which market to search in.
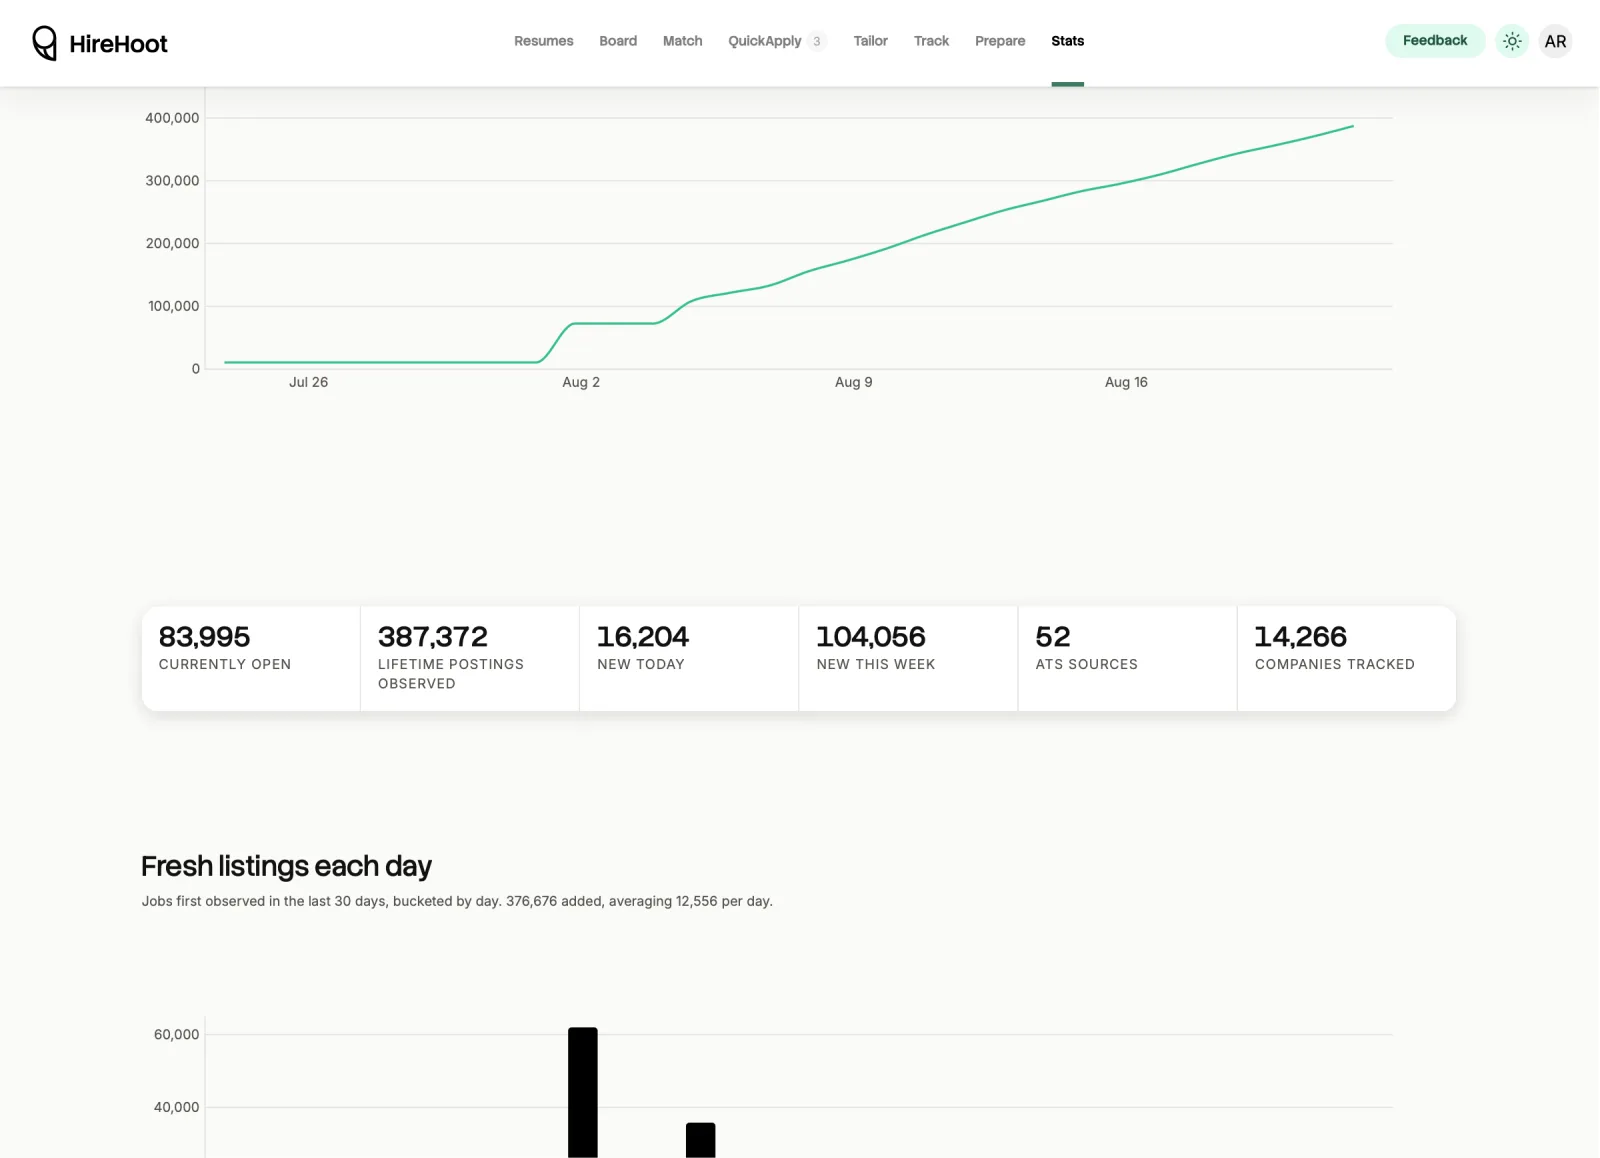
The market stats page: a line chart of every posting collected since launch climbing to roughly 390,000, above a row of counters reading 83,995 currently open, 387,372 lifetime postings observed, 16,204 new today, 104,056 new this week, 52 ATS sources and 14,266 companies tracked, with a bar chart of fresh listings collected each day beneath.
Live counts from our index, and how many new listings landed each day.

From real postings

Every figure traces back to postings collected from employer feeds.

Open to everyone

No account required. Nothing gated.

Honest about scope

Each page states what it is measuring and what it is not.

Free

Free, and available without an account.

Full documentation, including the limits

No employer pays us for placement, and your data is never sold. That is written down.