Market stats
What the hiring market actually looks like, from our own index
What it does
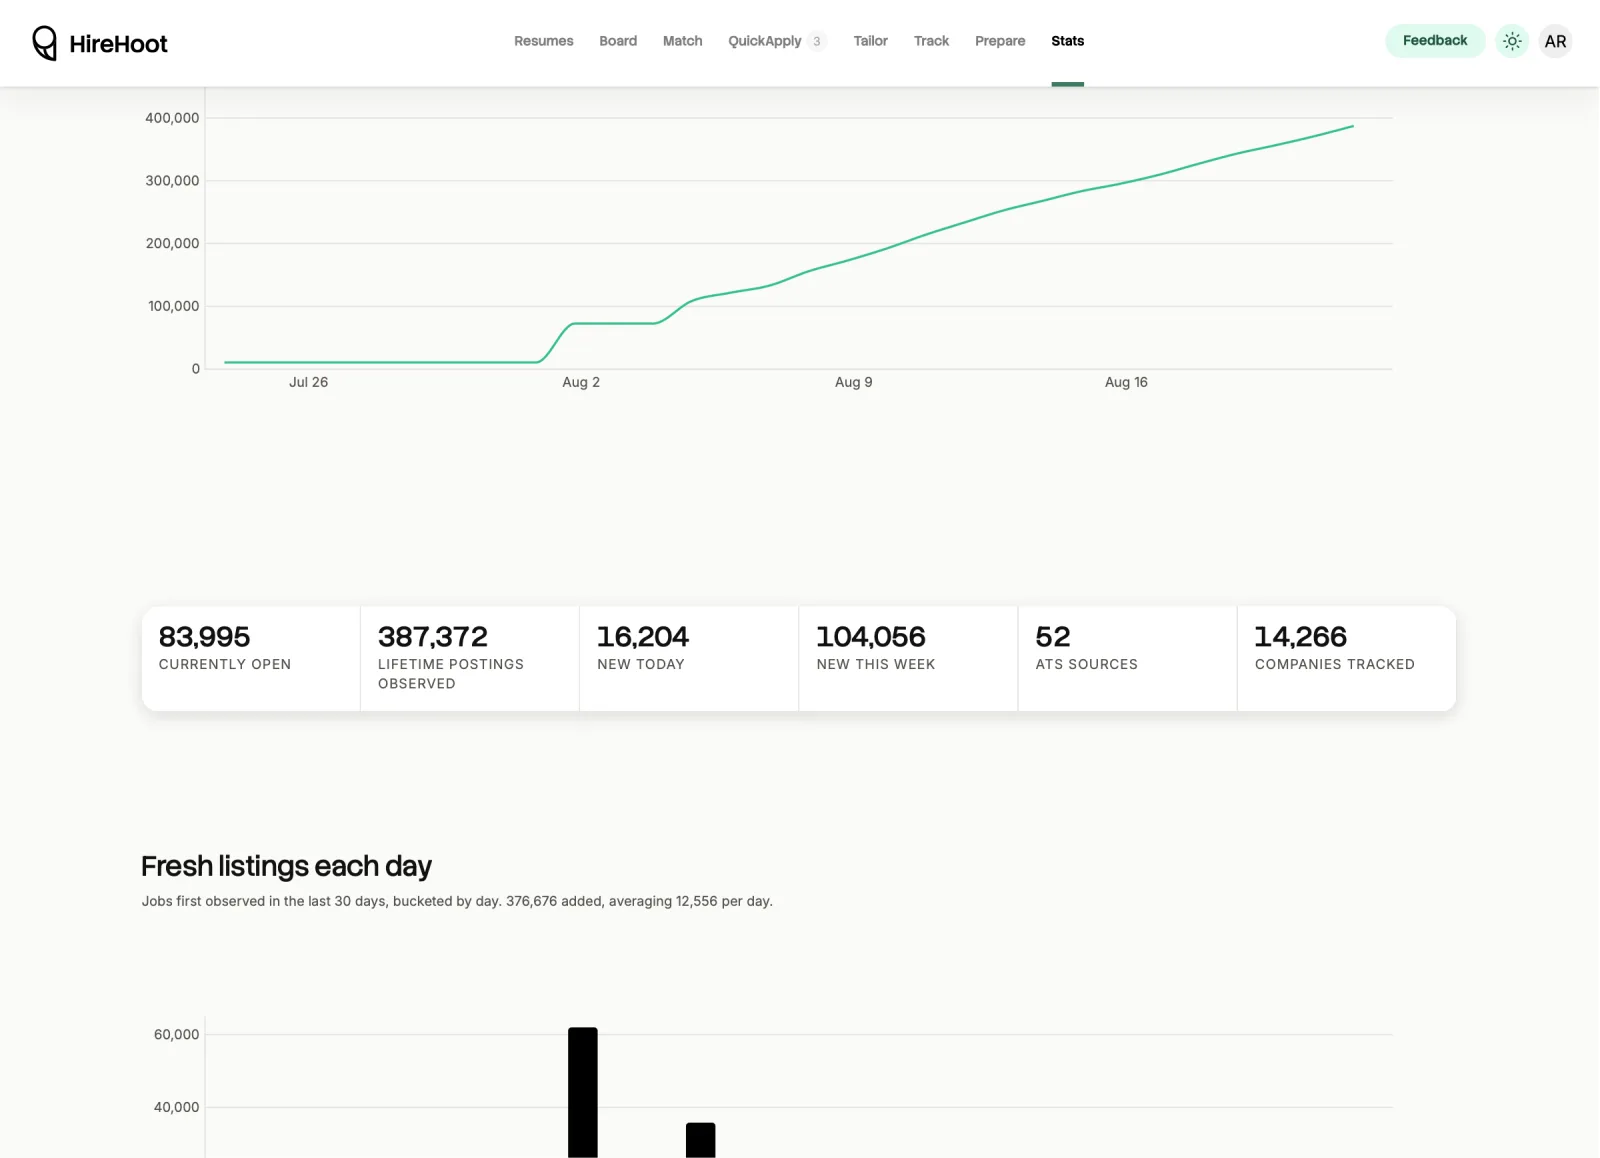
The market pages summarise our index of open roles: where the jobs are, who is posting them, and how those numbers move over time.
The companies directory is the same data organised by employer, with a page per company listing what they currently have open.
When to use it
- You are deciding which market, title, or seniority to aim at.
- You want to know whether a specific company is currently hiring, and for what.
How to use it
-
Start at the hub
The market hub links each view. Every page carries a short note on what the numbers count.
-
Read the methodology note
Each page states its scope. That is the part that tells you what the chart can and cannot support.
-
Drill into a company
The companies directory has a page per employer with their current open roles, which links back to the board.
What it costs
Good to know
This is our index, not the whole economy
The figures describe postings we collect from employer feeds. Employers who do not publish a feed are not represented, so treat it as a large sample and not a census.
Counts move as roles close
Postings are culled when they leave their source feed, so totals fall as well as rise. That is the number being honest, not a bug.